Molecular Phylogeny and Morphology Reveal the Underestimated Diversity of Mortierella (Mortierellales) in Korea

 Jae-Sung Lee, Bora Nam, Hyang Burm Lee,    Young-Joon  Choi1,2,*   

1Department of Biology, Kunsan National University, Gunsan 54150, Korea
2Center for Convergent Agrobioengineering, Kunsan National University, Gunsan 54150, Korea
3Division of Food Technology, Biotechnology and Agrochemistry, Chonnam National University, Gwangju 61186, Korea

Abstract

Members of the genus Mortierella (Mortierellales) are filamentous fungi, which are found on nearly all substrates, but more frequently in soil. Till date, 7 species of Mortierella have been reported in Korea, but being a ubiquitous group with high species diversity in temperate zones, this number is still low. During a survey of fungal biodiversity in Korea, we collected many isolates of Mortierella, and through morphological and molecular phylogenetic analyses, identified them to be 3 previously unrecorded species, namely, M. chienii, M. epicladia, and M. gamsii. A total of 10 Mortierella species in Korea, including the 3 species reported in the present study, are widely distributed in 5 out of 7 phylogenetic groups of this genus. This indicates that the diversity of Mortierella was so far underestimated in Korea. Multi-locus sequence analysis is required to provide a more reliable backbone for some uncertain phylogenetic groupings and to more clearly define a species of Mortierella, which would encourage deeper research in the diversity and ecological roles of Mortierella and allied genera.

Acknowledgements

This study was supported by a grant from the National Institute of Biological Resources (NIBR), funded by of the Ministry of Environment (MOE) and the National Research Foundation of Korea (NRF), funded by the Ministry of Science, ICT & Future Planning (2016R1C1B2008013) , Republic of Korea.

Figures & Tables

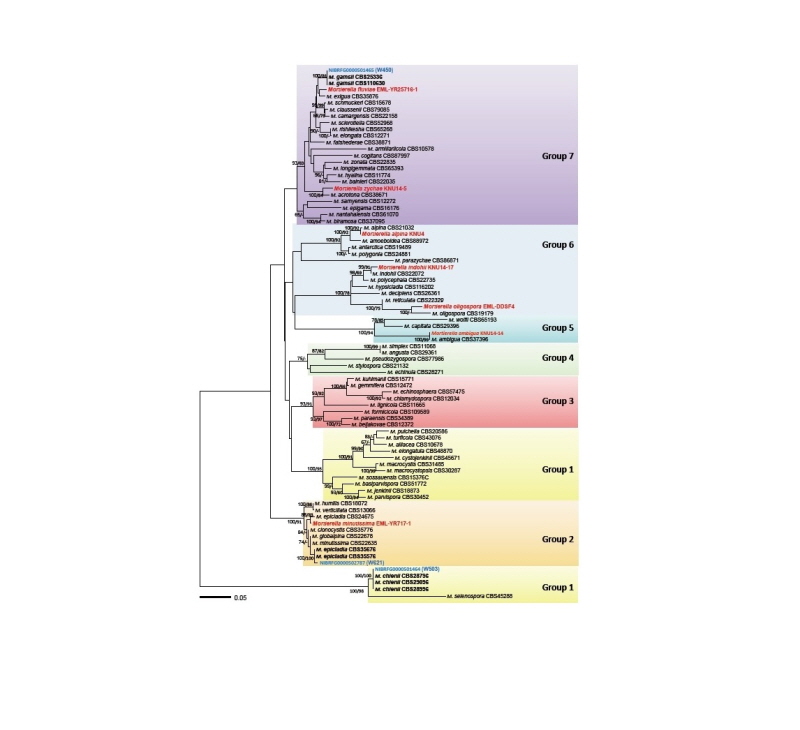
Fig. 1. Minimum evolution tree based on the internal transcribed spacer rDNA sequences. Bootstrapping support values of minimum evolution and maximum likelihood methods higher than 60% are given above or below the branches. The species revealed in the present study are shown in blue while the previously known species are shown in red. The scale bar equals the number of nucleotide substitutions per site.