Abstract
Figures & Tables
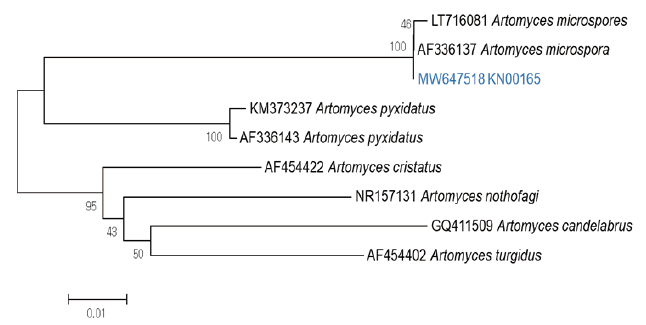
Fig. 1. Phylogenetic relationships of based on intermal transcribed spacers (ITS) region sequences. Number on branch is bootstrap values 1,000 replicate analysis. genetic distance between samples. Bar=0.01 (Blue color font : strain used in the study accession no. MW647518).